Final Project Part IIB:
Stamp Prices
by
Jenny Johnson
We can use a data set that includes the prices of US
stamps from 1933 to 2008 to explore the uses of spreadsheets, the idea behind
building lines and other models of best fit, and to use scatterplots to make
predictions about prices in the future.
Below is a picture of a spreadsheet in Excel that includes stamp prices
for a 75-year period.
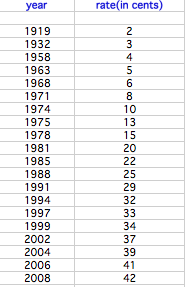
Clearly, the prices have steadily increased, but
have they followed a linear trend? A logarithmic trend? A cubic trend?
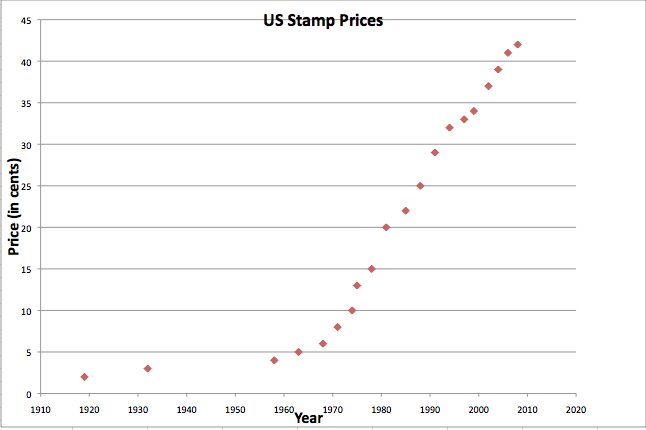
We can find which model predicts our information
best by constructing a scatterplot in Excel.
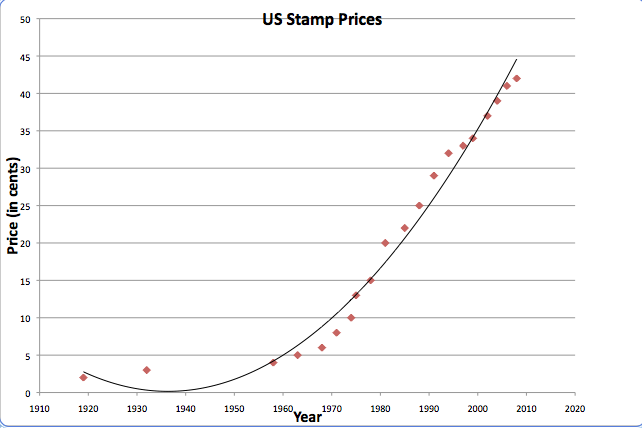
First, we will construct a line of best fit to see
how closely the data fits a linear model.
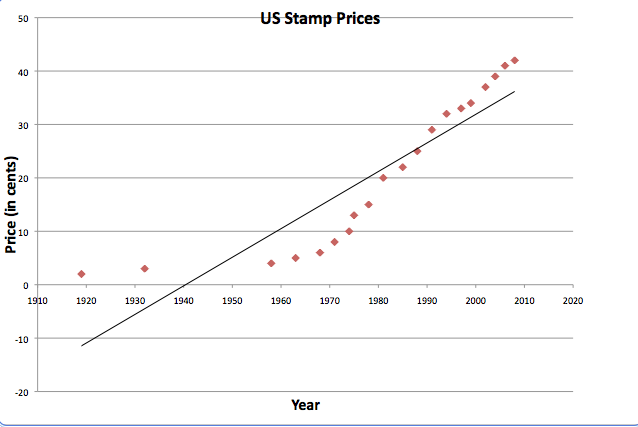
The line of best fit over-predicts the values of the
stamps from 1960 to 1990 and under-predicts the stamp values from 1990 to
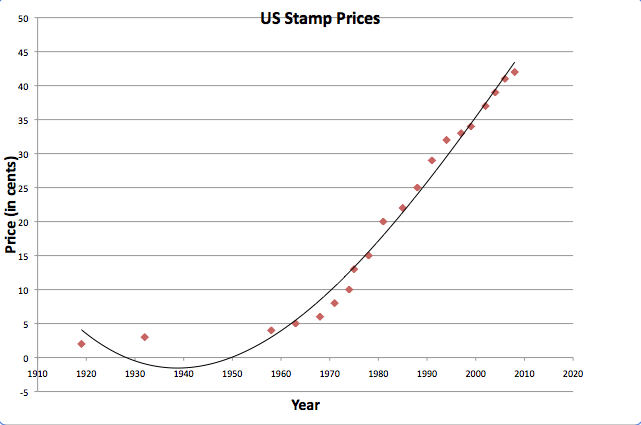
2010. Let us try constructing a
quadratic graph to see if it predicts the values more accurately than the
linear model. The r2 is .8071 which means the variables are quite strongly
linearly associated.
The quadratic model fits the data better than the linear
model. The graph still
over-predicts the price of stamps from 1960 to 1980 and under-predicts the
values from 1980 to 2000, but the residuals are not as large as in the linear
model. The r2 is 9815, which means the quadratic model is a very
good predictor of the price of stamps, even more than the linear model.
Now let us construct a cubic model for the data.
The cubic model seems to predict the price of stamps
the most accurately of the three models we have tried. The r2 value for the cubic
model is .98428 so this is a good predictor and it is a more accurate predictor
of price than the quadratic model.
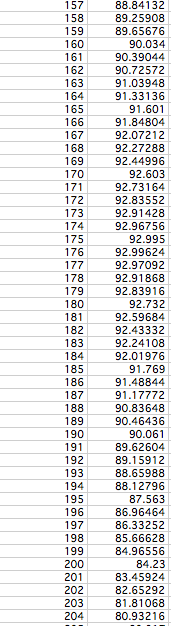
Now we can use our model to predict prices in the
future. Using the cubic equation given by Excel, we get the following data
values up to the year 2034.
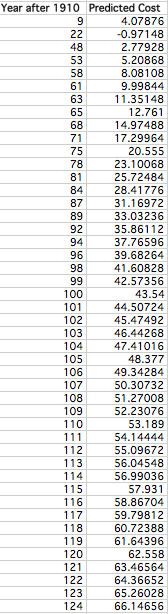
The first column is the number of years after
2010. As seen in the chart, the
equation produced by Excel gives that the next 3 cent increase will be in the
year 2012 (since that’s the year it gets over 45 cents). It is predicted that the cost of the
stamp will cost 64 cents in the year 2032. According to my cubic model, the stamp will actually never
reach $1.00 because the maximum value is 93 cents before the price starts to
decrease. But, it is dangerous to extrapolate data that far into the future anyway
since the data reaches 93 cents in the year 2086 and several different things
could change. The data far into
the future is shown in the following chart. The cubic model might not be a good predictor for several
years into the future.